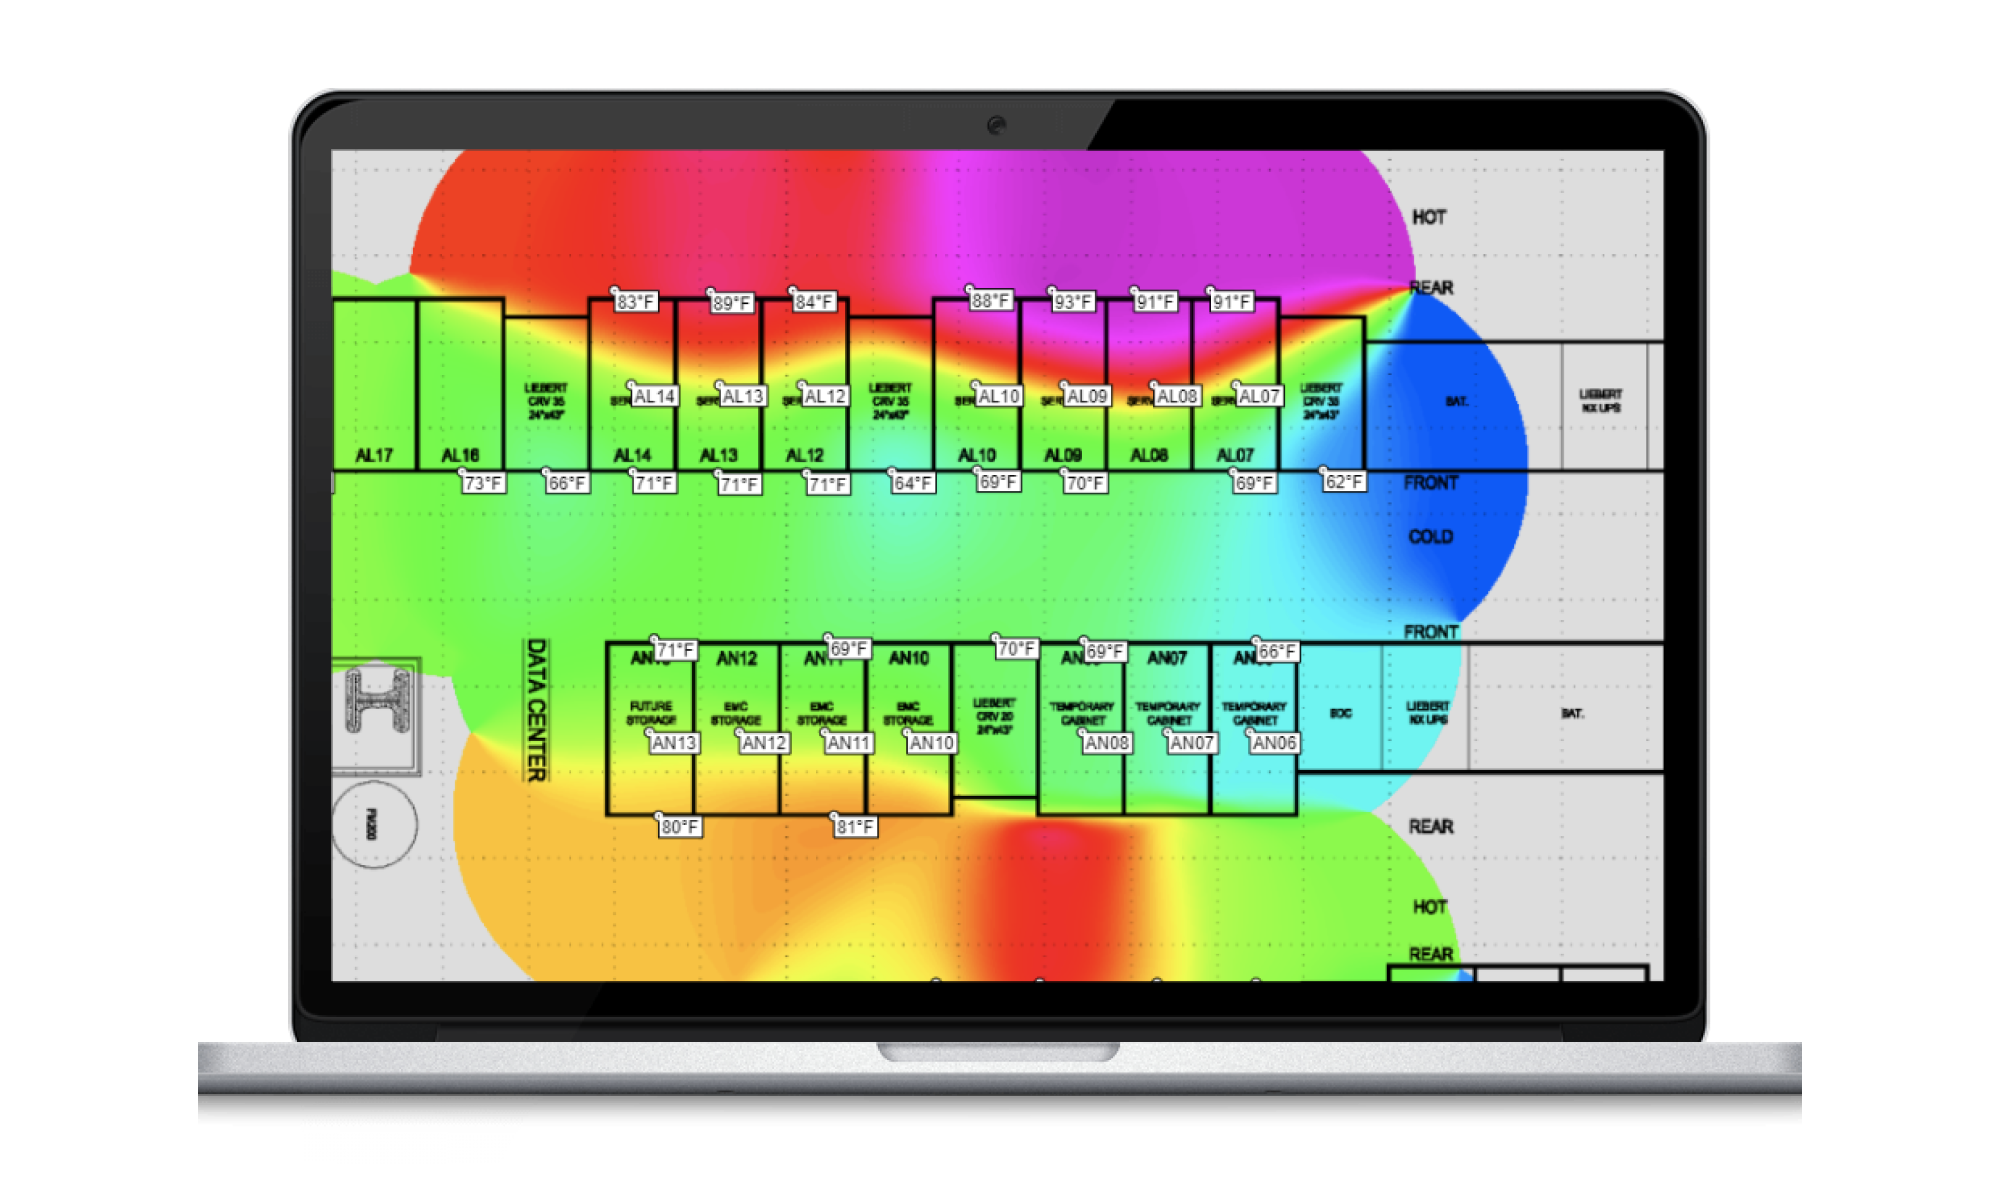

Every Picture Tells a Story
- Observe temperature impacts from infrastructure deployments
- Ensure heat containment solutions are working
- Maintain circuit phase balance to prevent outages
- Hold facilities and collocation providers accountable for SLA’s
- Monitor how adjustments to HVAC efficiency settings impacts desired space conditions
- Identify risk, reliability concerns and pinpoint issues

How We Do It:
- Display hundreds of data points in a single view to understand the state of your environment
- Analyze current state or any historical point in time
- Animations allow historical playback to see changes to the environment
- Customizable map backgrounds and data overlays are extremely flexible
- Map any data type collected
